The Rise of Cashless Africa: Comparing Key Markets


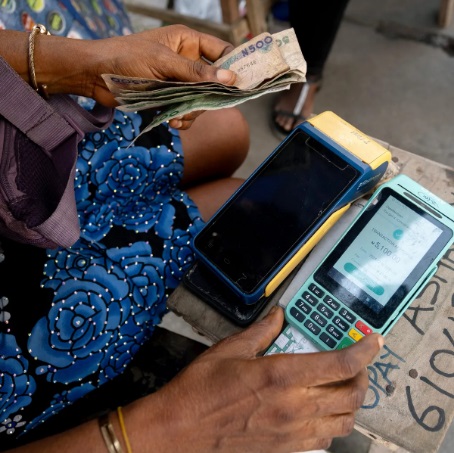

Comparative Analysis of Zimbabwe, South Africa, and Nigeria Digital Payments Landscapes:
Digital payments have become one of the most important drivers of financial inclusion, economic formalization, e-commerce growth and cross-border trade across Africa and the Middle East. While each market has evolved differently, common themes include the rapid growth of mobile money, increasing fintech innovation, regulatory modernization and growing consumer preference for cashless transactions.
Among the markets reviewed, Nigeria is Africa’s largest digital payments market by transaction value, South Africa leads in card payments and banking infrastructure, and Zimbabwe remains heavily mobile-money dependent.
# 1. Zimbabwe
(Market Overview)
Zimbabwe’s digital payments ecosystem evolved largely as a response to cash shortages and currency instability. Mobile money has become deeply embedded within everyday commerce and household transactions.
(Major Players)
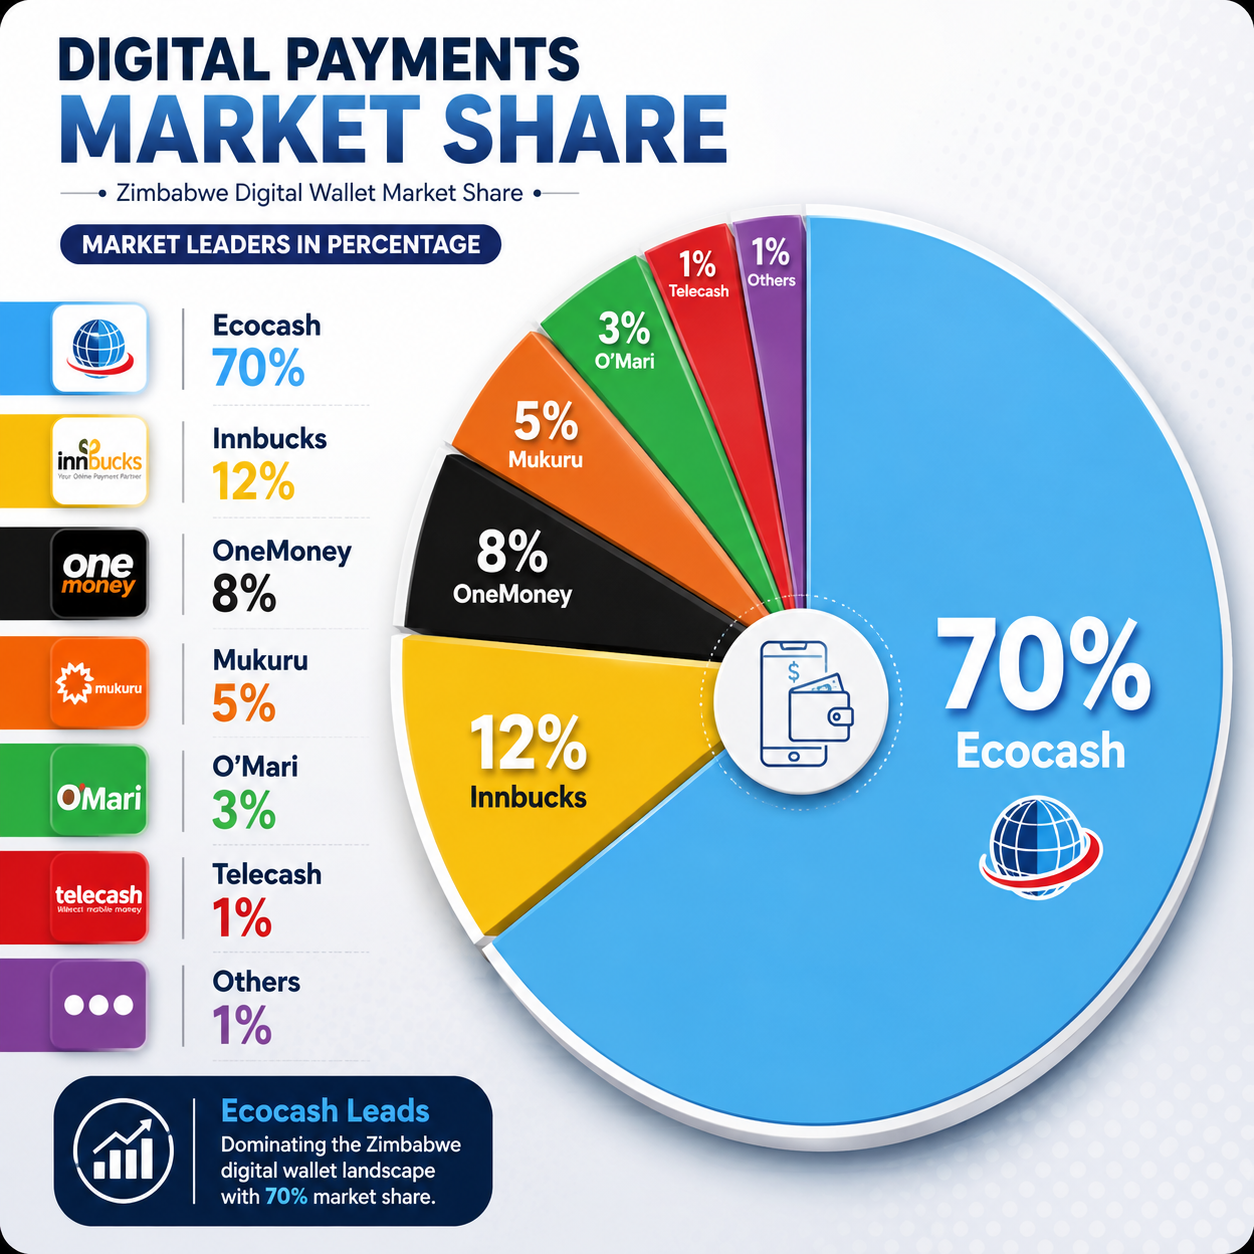
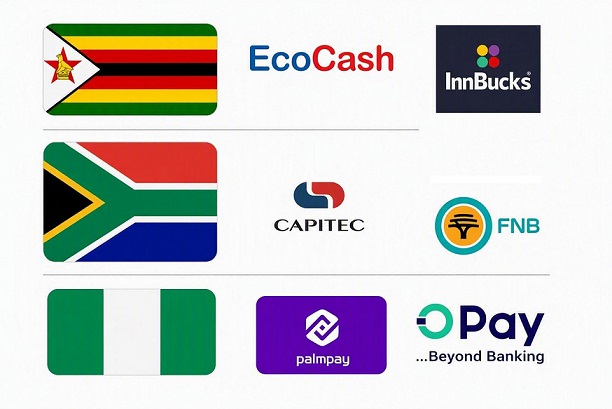
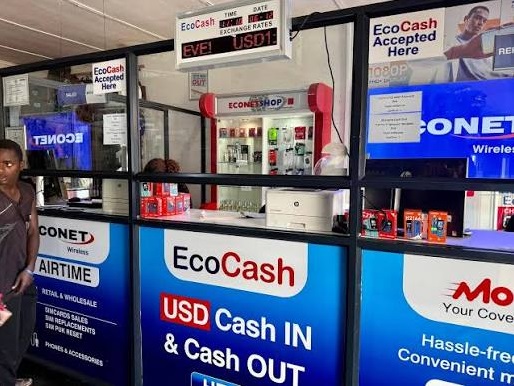
EcoCash remains the dominant player, accounting for more than 70% of national payment transactions and over 86% of the mobile money market according to industry and Reserve Bank-linked reporting.
Estimated Ecosystem Value
* Estimated annual digital payments volume: US$15–25 billion
* Mobile money remains the dominant payment channel.
* Merchant payments continue expanding rapidly.
(Key Drivers)
* Cash shortages
* Mobile penetration
* Informal sector dominance
* Diaspora remittances
* Financial inclusion
Challenges
* Currency volatility
* Regulatory intervention
* Trust concerns
* Liquidity constraints
# 2. South Africa
(Market Overview)
South Africa possesses the continent’s most mature banking and card payments infrastructure. While cash remains important, digital payments continue gaining market share.
(Major Players)
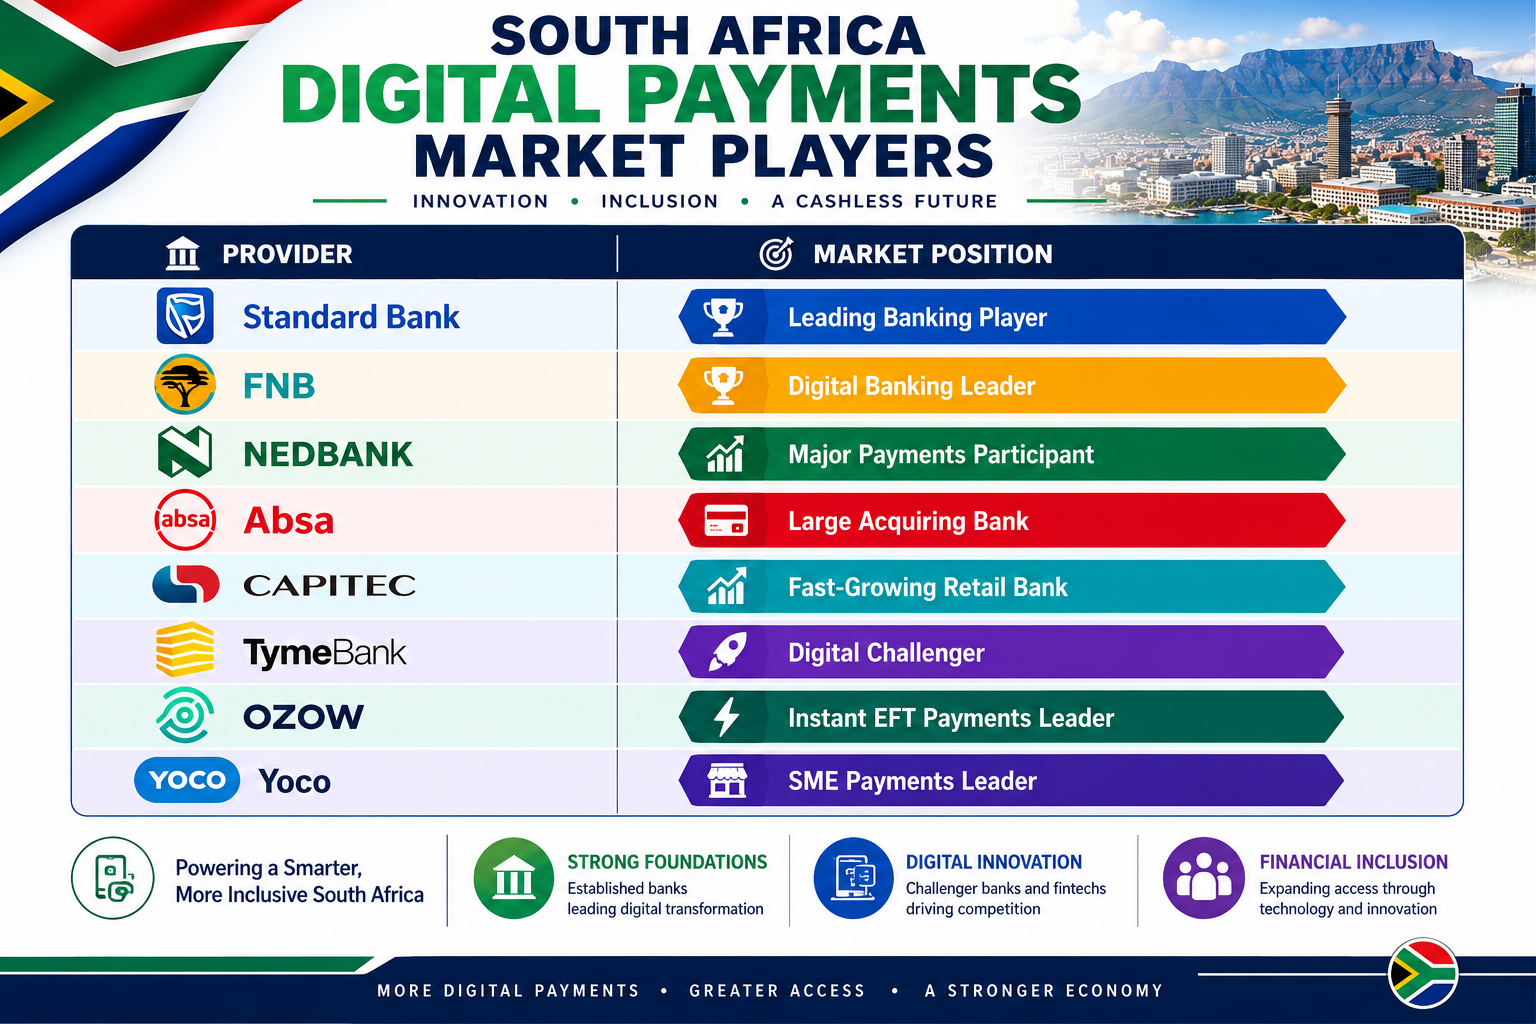
(Market Size)
South Africa’s card payments market reached approximately:
* ZAR 2.7 trillion (US$149 billion) in 2024
* Forecast ZAR 2.9 trillion (US$159 billion) in 2025
* Digital payments overall are estimated to exceed: US$150 billion annually
(Market Share Characteristics)
* Debit cards account for approximately 74% of card payment value.
* Card-based payments dominate retail commerce.
* Mobile wallets continue growing but remain less dominant than in Kenya or Zimbabwe.
(Key Drivers)
* Strong banking penetration
* E-commerce growth
* Contactless payments
* Instant EFT adoption
* Regulatory support
Challenges
* Cash dependence in informal sectors
* Cybercrime
* Financial exclusion in rural communities
# 3. Nigeria
(Market Overview)
Nigeria is Africa’s largest digital payments market by transaction value and one of the world’s fastest growing fintech ecosystems.
(Major Players)
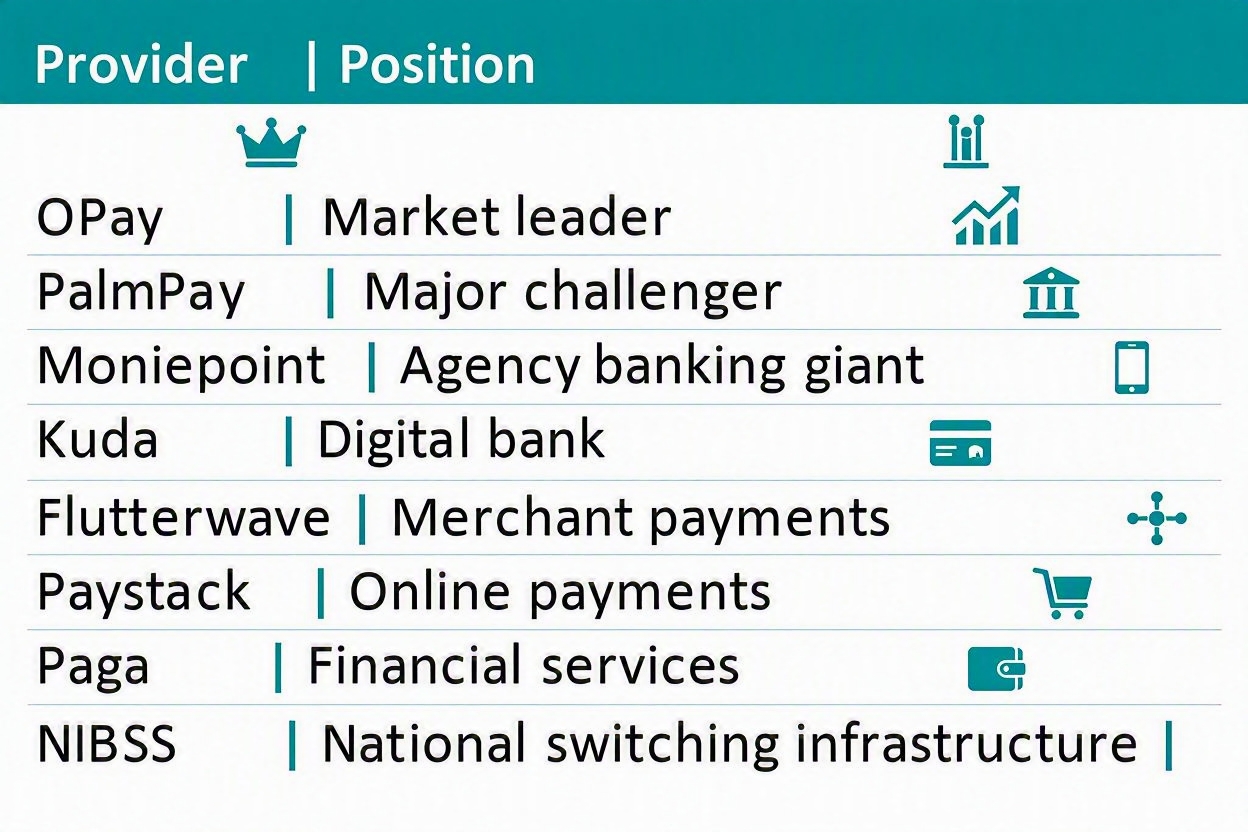
(Market Size)
Nigeria’s e-payment transaction value reached:
* ₦3.1 Quadrillion (approximately US$2.03 trillion) in 2024.
*Mobile money operators processed: ₦71.5 trillion (approximately $53.79 billion US Dollars) in 2024.
*Nigeria accounts for over 70% of Africa’s e-payment transaction volume.
(Key Drivers)
* Large population
* Smartphone growth
* Financial inclusion
* Agent banking
* E-commerce
(Challenges)
* Regulatory uncertainty
* Fraud
* Infrastructure reliability
* Currency volatility